I’ve always loved playing with different tools and solving problems at home. So, one day, I found myself working on a really cool mini-project that began with a challenge.
Here’s what happened: I wanted to see the data from my solar converter unit on my phone, but I couldn’t use an existing app to do that. The official app provided by the company was another option, but unfortunately, it was just too slow.
Plus, I wanted an even simpler solution. I didn’t want to have to open an app every time and wait for it to update just to see my solar array data. So, what did I do? I decided to start my own project to solve this issue. Read on to find out more!
The journey
When I first embarked on my journey to access the data from my Autarco solar system, I was not sure if there was an API that could help me with it. So, what did I do? I turned to my trusty friend, Google.
After a bit of searching, I came across a page on GitHub. This page explained everything I needed to know about the APIs, and even gave me the correct security settings for getting the data I wanted.
Next, it was time to start experimenting. I used a tool called Postman. It took me some time, but eventually, I got the API responses I was looking for.
But the adventure didn’t stop there! I had the data, but I still needed to display it. Once again, I found myself on Google, looking for ways to use a standard display to show the values.
Luckily, I found many helpful resources. They explained how to set up the hardware and even gave me some Python examples to use
The parts needed
- Raspberry PI zero W
- SD card for OS and code
- Mini HDMI converter to normal HDMI
- USB mini to standard USB converter for USB keyboard/Mouse
- USB mini power adapter for Raspberry PI zero
- LCD16x2 display with header pins
- 10K Ohm potentiometer
- Breadboard
- Jumpercables
But the adventure didn’t stop there! I had the data, but I still needed to display it. Once again, I found myself on Google, looking for ways to use a standard display to show the values.
Luckily, I found many helpful resources. They explained how to set up the hardware and even gave me some Python examples to use
The hardware setup
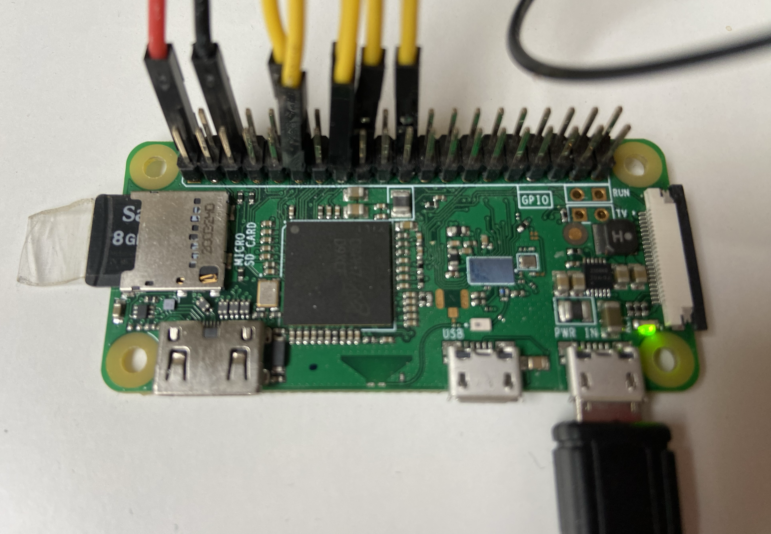
Below you can see how I did all the wiring from the Raspberry towards the display. This is pretty straight forward as you can find many of these wiring diagrams on the Internet.

Connection to the Raspberry
After you have connected all the wires (or also before that 🙂 ) you can/need to install an OS on the Raspberry. I simply used the default operation system and flashed it using Balena etcher onto the SD card. After this, I did the following steps:
- Connect USB keyboard and mouse (using usb hub)
- Connect to a HDMI monitor
- Run default install on the raspberry
- Connect it to my WiFi network
- Give Raspberry PI fixed IP
Then I connected via a VNC client from my Mac to the Raspberry, after this is working I disconnected the USB keyboard/mouse and HDMI connections as I did not need them anymore since I could now work via VNC.
Now the software setup and programming could start.
Software to run the code
The software is written in Phyton and I symply used the default editor “thonny” from the Raspberry OS. First I connect to the Rasberry via VNC so I can controll the desktop and just start writing the code.
Since we need certain libraries we need to install them first. How to do is, is pretty simple. Open the terminal on the Raspberry and execute the following commands:
git clone https://github.com/pimylifeup/Adafruit_Python_CharLCD.git
cd ./Adafruit_Python_CharLCD
sudo python setup.py install
after you have installed this we can start coding. High level we are going to initialise the board and display then start a loop which pols the API for the data.
The loop is running every 5 minutes between 6 am and 10 pm. Calling the API outside this timeframe is useless since there is no sun/light so the result will always be zero.
IMPORANT: This project only works with the solar convertor from the Brand Autarco, but i’m confident that the code easily can be refactored to work with another brand. The only thing you need is the API access and structure how to retrieve it
Below can you can see the code I used to get this project working.
In the URL of the API you see the place holder for a personal code, this must be replaced by your personal code.
You can retrieve/find this code visiting and log in on https://my.autarco.com/ when you logged in, look in the browser bar to find the code after the last slash: my.autarco.com/site/CODE Copy this code and use it instead of the [YOURPERSONALCODEID] placeholders.

In the API section of the code you see that I used BASE64 encoding to send my login and password towards them. Also this placeholder needs to be replaced with your own security data. If you have no tool to todo this, you can use the site https://www.base64encode.org you then key in the login:password (use the semicolon as divider) then press encode and you get the result you need to use.
Python code
from time import sleep, perf_counter
import board
import requests
import digitalio
import datetime
import adafruit_character_lcd.character_lcd as characterlcd

lcd_columns = 16
lcd_rows = 2

# set start and end time to start polling data
# polling in the night time is useless since there is no solar energy
start_time = datetime.time(6, 0) # set the start time to 6:00 AM
end_time = datetime.time(22, 0) # set the end time to 10:00 PM

# compatible with all versions of RPI as of Jan. 2019
# v1 - v3B+
lcd_rs = digitalio.DigitalInOut(board.D22)
lcd_en = digitalio.DigitalInOut(board.D17)
lcd_d4 = digitalio.DigitalInOut(board.D25)
lcd_d5 = digitalio.DigitalInOut(board.D24)
lcd_d6 = digitalio.DigitalInOut(board.D23)
lcd_d7 = digitalio.DigitalInOut(board.D18)
lcd_backlight = digitalio.DigitalInOut(board.D13)

# Initialise the lcd class
lcd = characterlcd.Character_LCD_Mono(lcd_rs, lcd_en, lcd_d4, lcd_d5, lcd_d6, lcd_d7, lcd_columns, lcd_rows)

# wipe LCD screen before we start
lcd.clear()

while True:
  current_time = datetime.datetime.now().time() # get the current time
  if start_time <= current_time <= end_time: # check if the current time is between start and end time

 # Get PV actual power from sun
 url = "https://my.autarco.com/api/site/pos/kpis/power"
 payload={}

 # Below you should a the Base64 encoding of your login and password from my.autoraco.com
 headers = {'Authorization': 'Basic [YOURENCODEDCREDENTIALS]'}
 response = requests.request("GET", url, headers=headers, data=payload)
 data = response.json()

 #added some trailing spaces to prevent old values showing.
 lcd_line_1 = "PV wh: " + str((data['pv_now'])) + " "

 # Get Daily power produced solar system
 url = "https://my.autarco.com/api/site/[YOURPERSONALCODEID]/energy"
 payload={}

 # Below you should a the Base64 encoding of your login and password from my.autoraco.com
 headers = {'Authorization': 'Basic [YOURENCODEDCREDENTIALS]'}
 response = requests.request("GET", url, headers=headers, data=payload)
 data = response.json()

 #added some trailing spaces to prevent old values showing.
 totalDayPV= data['stats']['kpis']['pv_today']
 lcd_line_2 = "Today: " + str(totalDayPV) + " KWh "

 # combine both lines into one update to the display
 lcd.message = lcd_line_1 + "\n" + lcd_line_2

 # Time to wait to re-execute every 5 min
 sleep(300)
  else:
 lcd.clear()
 sleep (3600) # wiat an hour to recheck the timeslot
Disclaimer
Building this and getting it to work is your own responsibility. You need some basic computer skills and understanding to get this working.